Overview
Supply, Use and Input-Output Tables (SU-IOTs) are made up of the Supply and Use Tables (SUTs) and the Input-Output Tables (IOTs).
The SUTs provide detailed information on the economy’s production activities by recording transactions between producers and consumers within the economic system.
Derived from the SUTs, the IOTs are used for economic studies such as impact analysis from demand shocks and industry interdependence.
Our Data Explained
Glossary
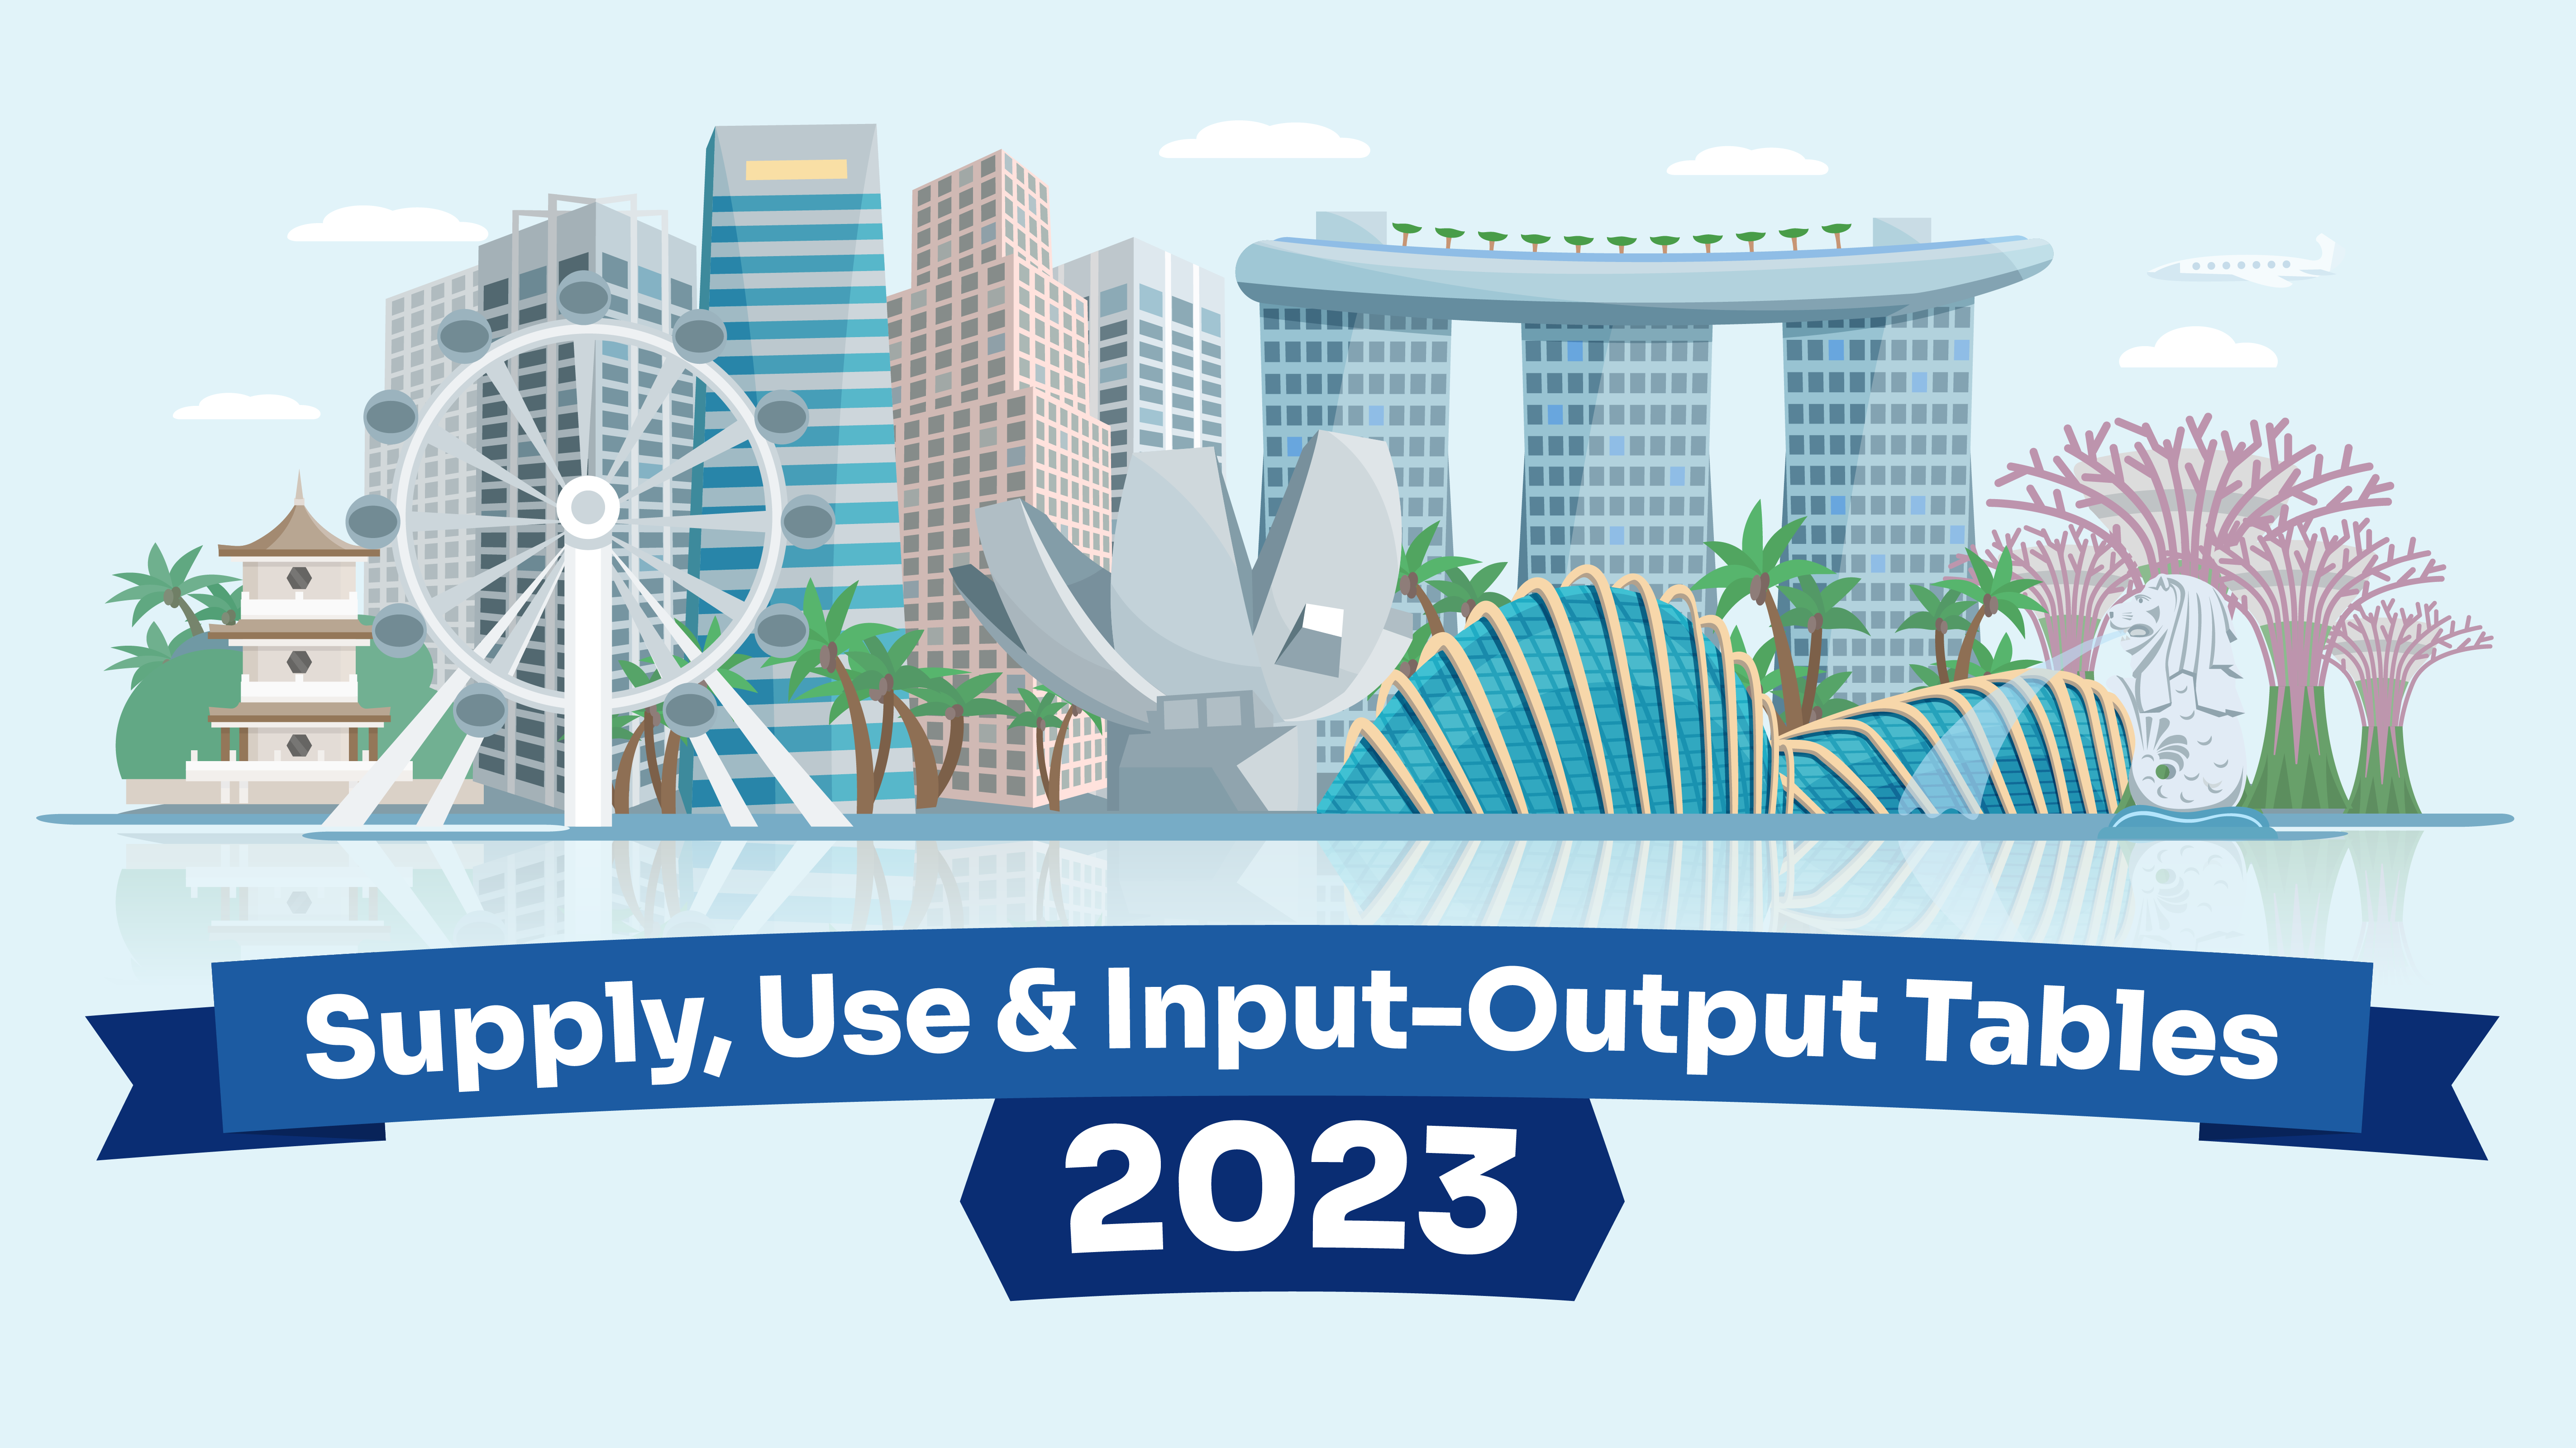
Supply, Use and Input-Output Tables 2023
This infographic presents the latest data from Singapore's Supply, Use and Input-Output Tables (SU-IOTs) 2023 and explains the key concepts in an easy-to-understand format.
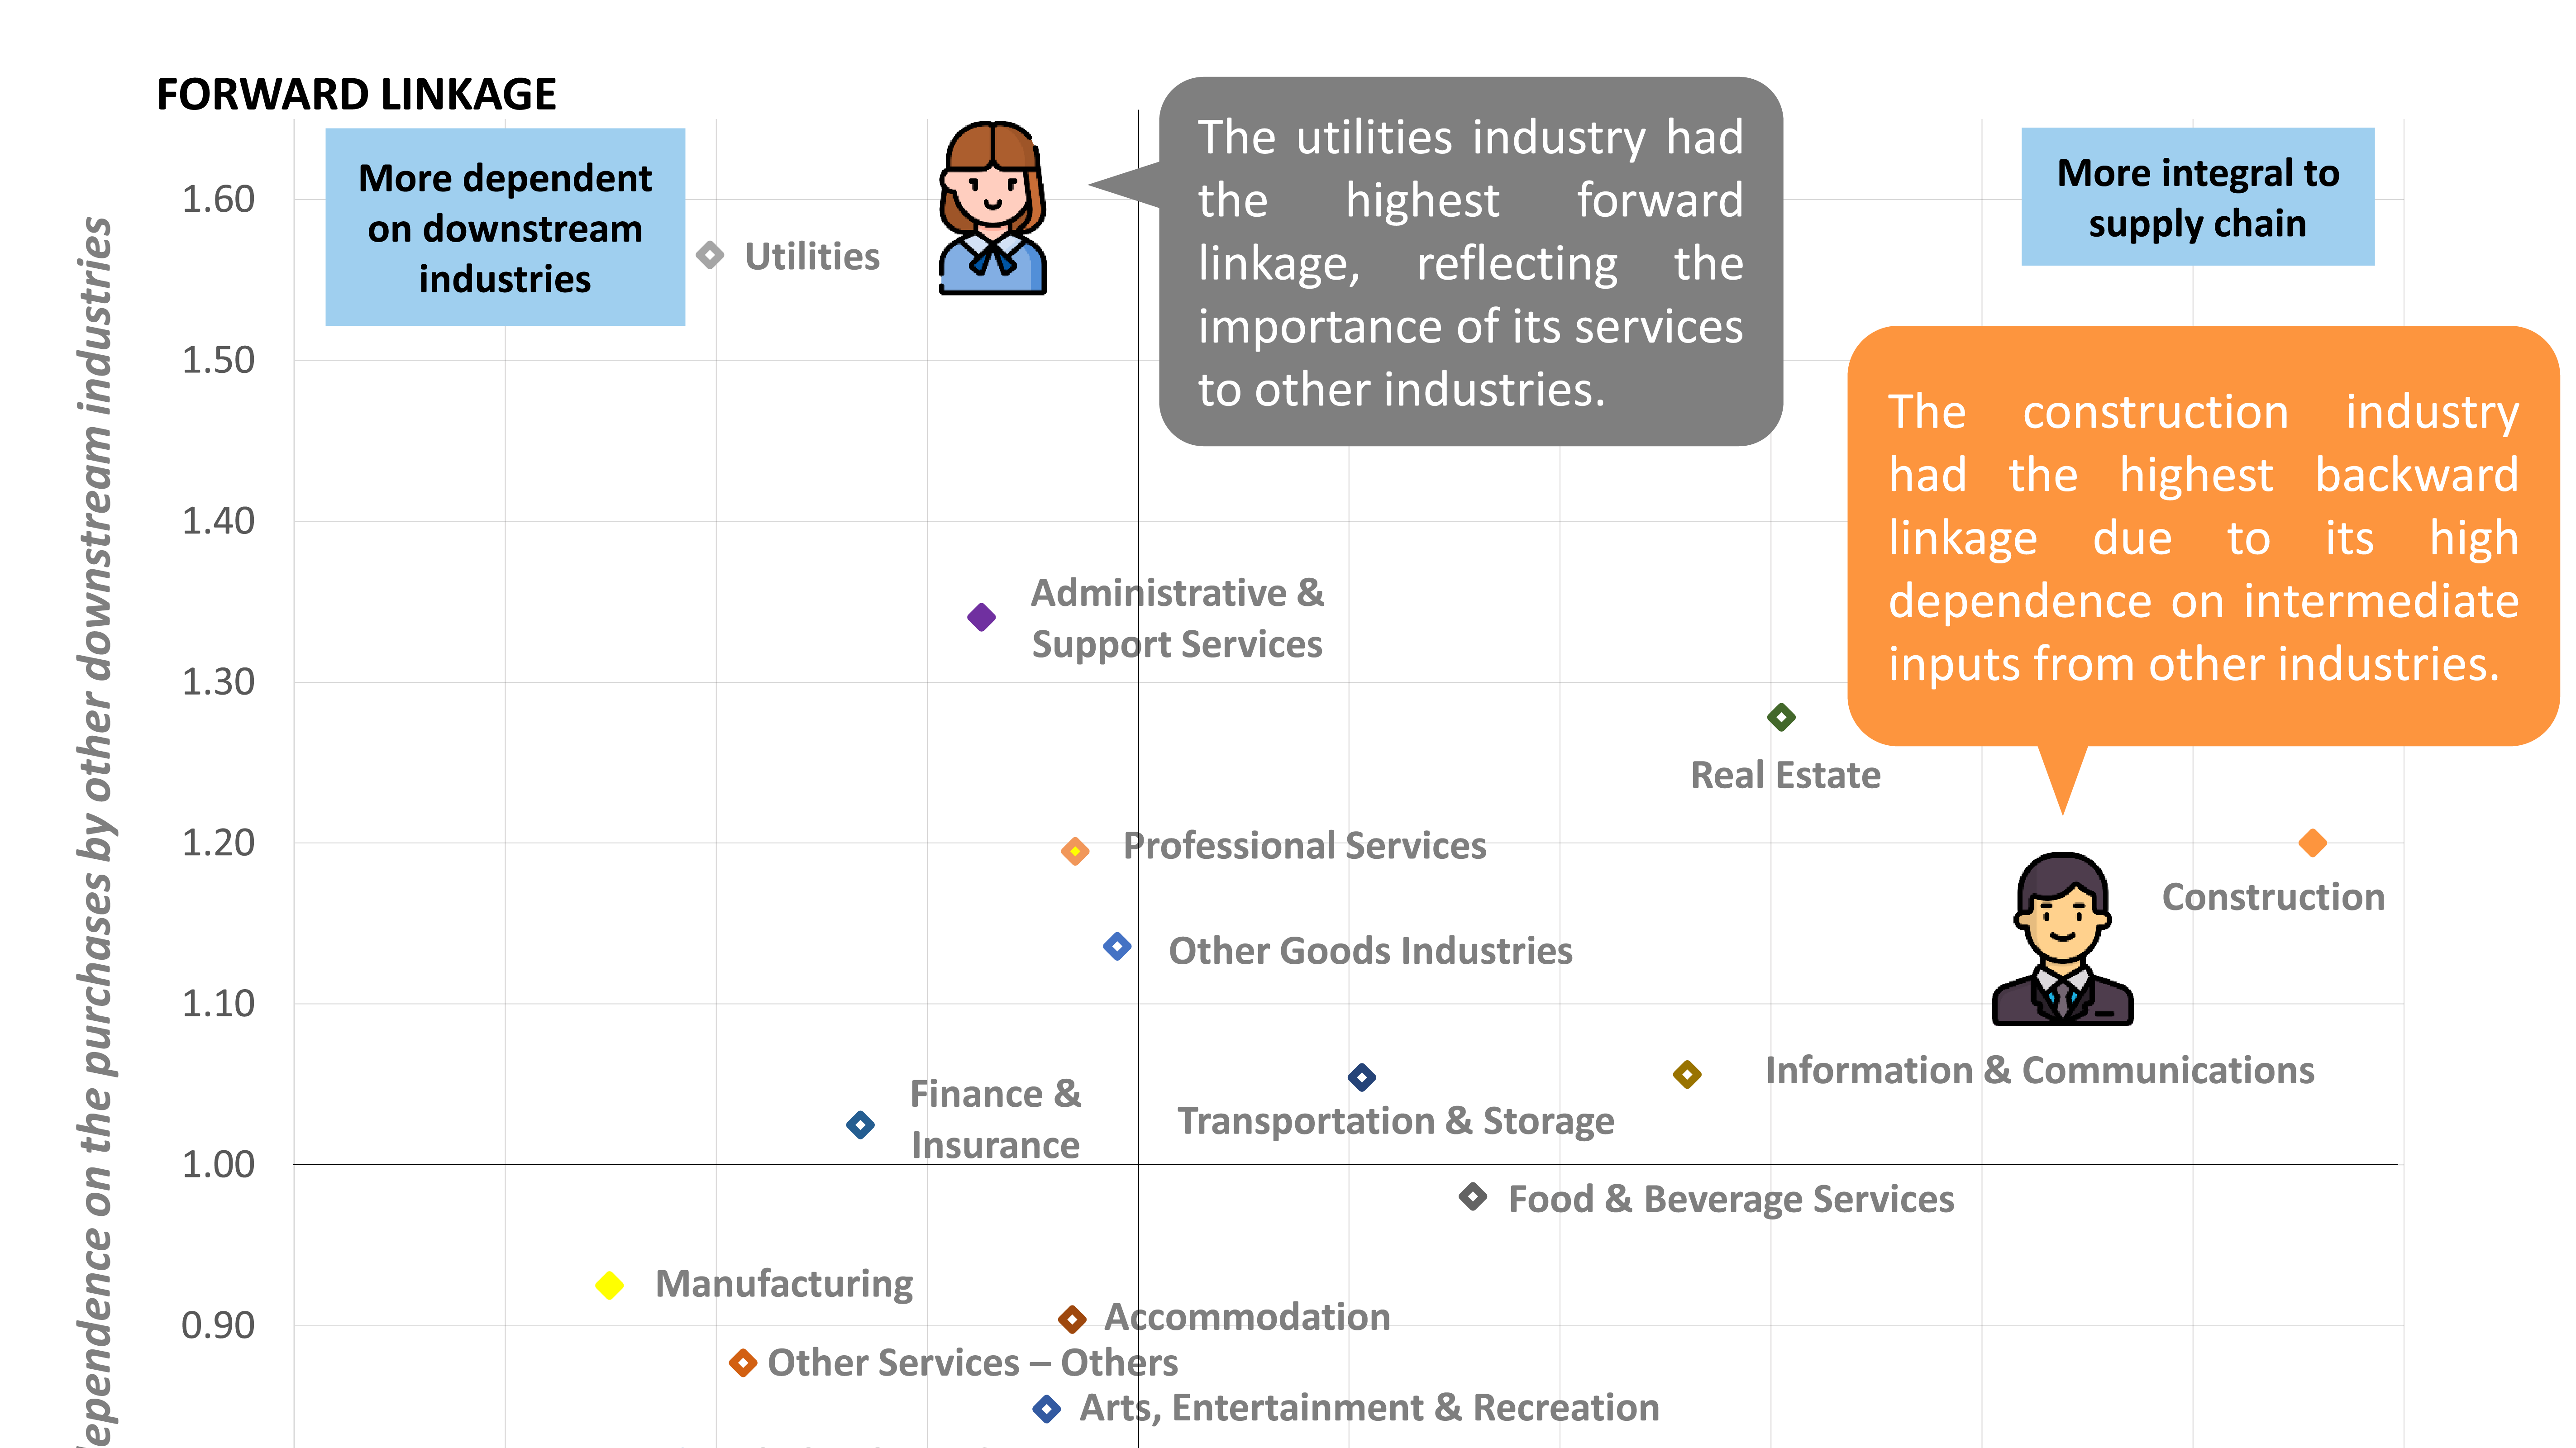
Multipliers and Linkages 2023
Multipliers and linkages from Input-Output Tables 2023.
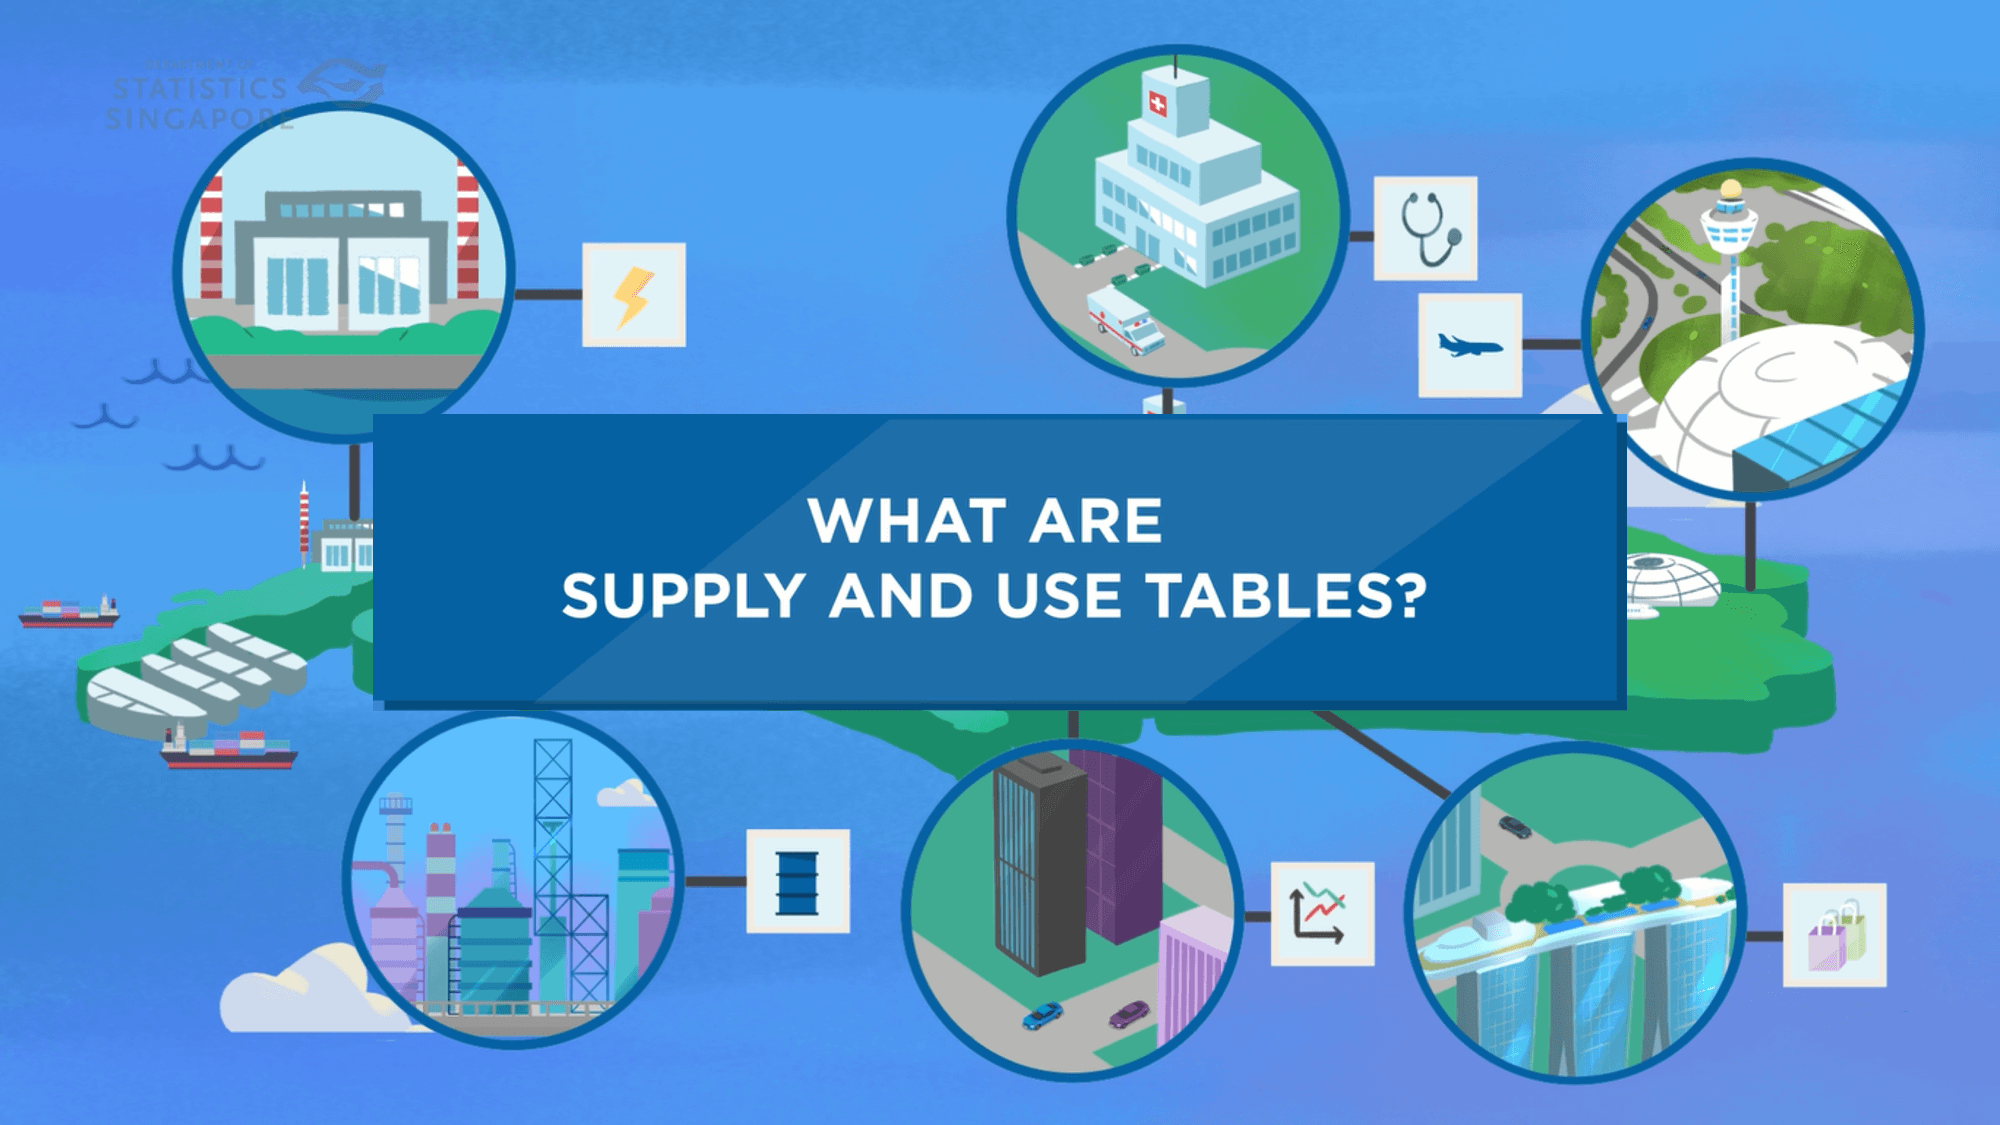
What are Supply and Use Tables?
This video explains how Supply and Use Tables organise transactions between producers and consumers in an economy.
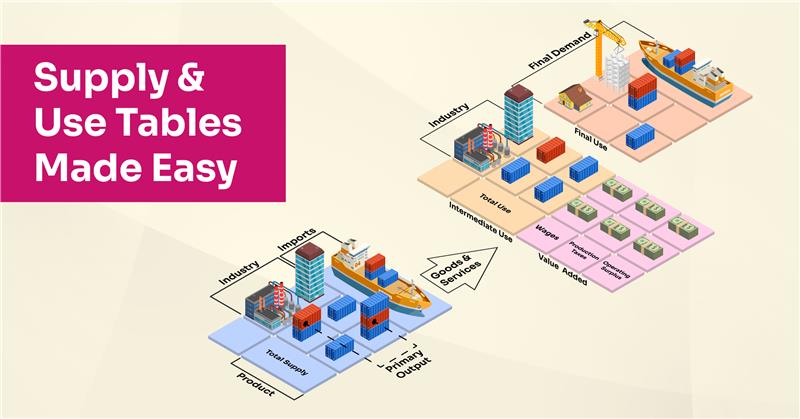
Supply and Use Tables Made Easy
A graphical guide to the concepts of flows of goods and services.
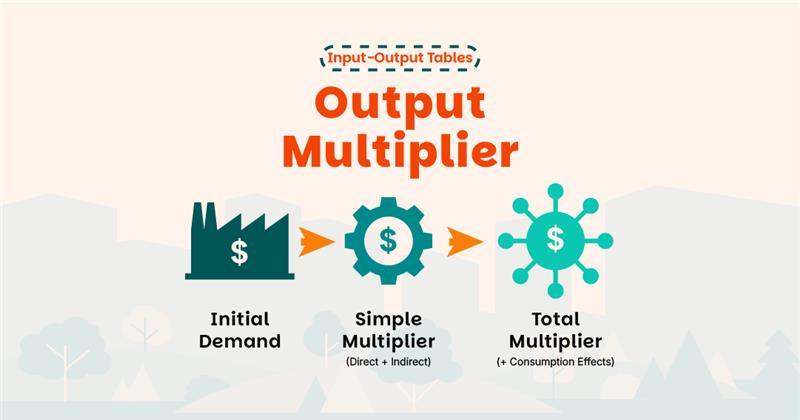
Output Multiplier
An illustrated explanation of the output multiplier.
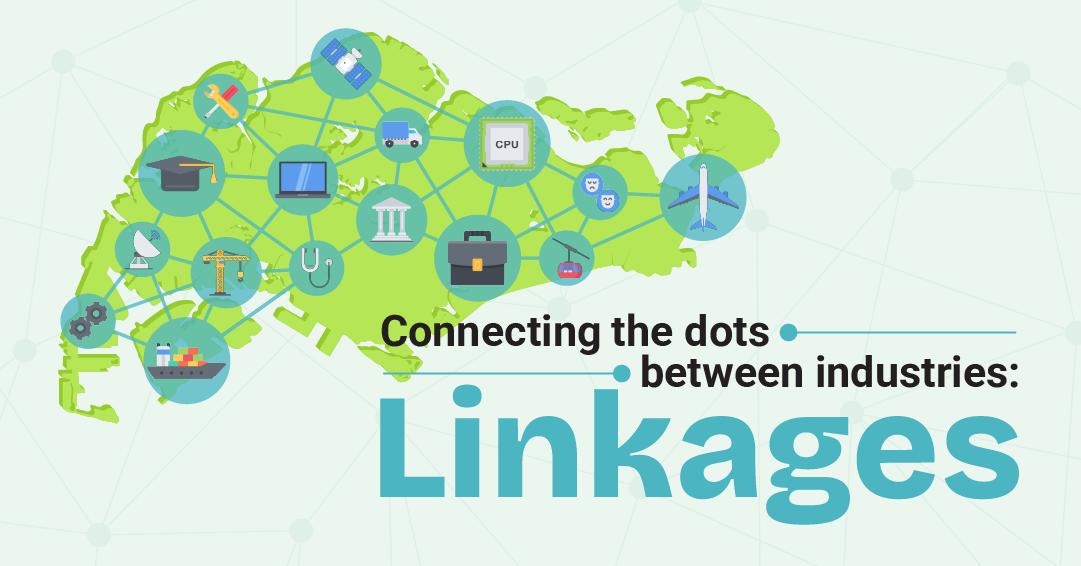
Connecting the Dots Between Industries: Linkages
A graphical guide to backward and forward linkages.

How do Concerts Held in Singapore Benefit the Economy?
This infographic explains the impact of concerts on Singapore's economy.
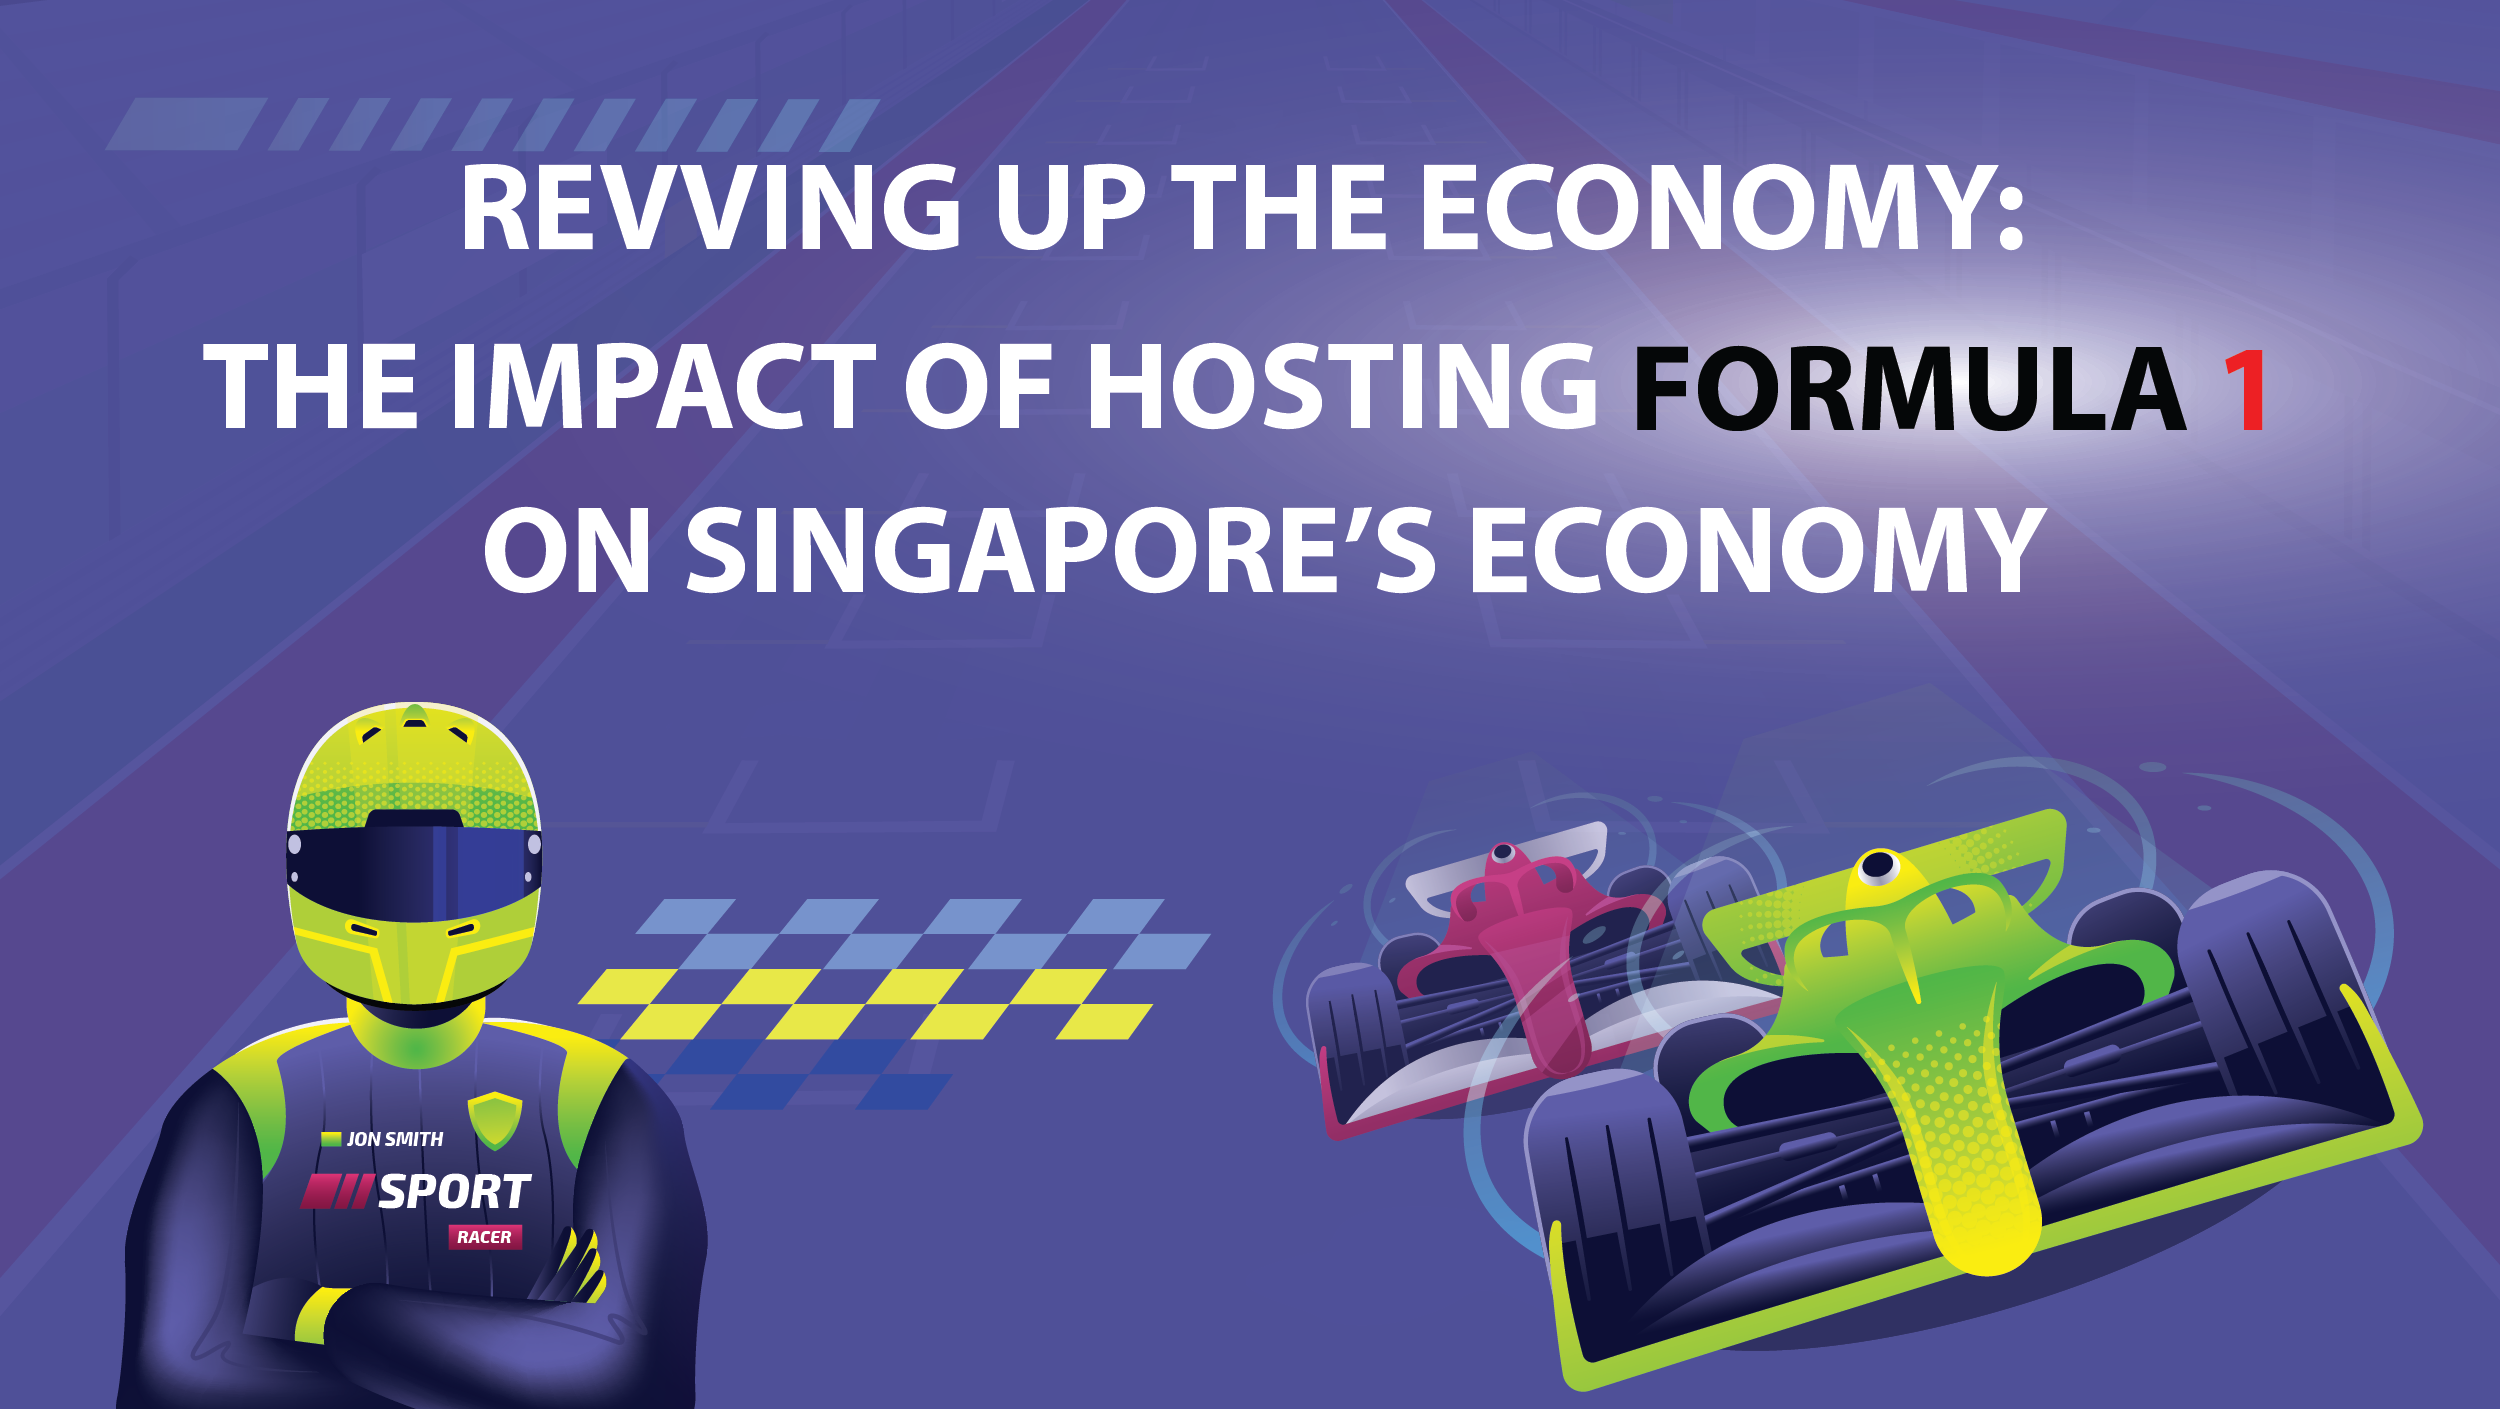
How Does Hosting Formula 1 (F1) Benefit Singapore's Economy?
This infographic explains the impact of F1 on Singapore's economy.
How does Trade Contribute to Output-based GDP?
Graphical overview of how trade, i.e., exports and imports, contributes to output-based GDP.