
Overview
Household income comprises income from employment and non-employment sources, such as investment income, rental income, or government contributions. It measures the economic well-being of households and reflects the resources that households receive.
Explore this section for more information on household income trends, income inequality, and the impact of government transfers and taxes on household income.
Other subjects in this theme
Our Data Explained
The Gini coefficient is a summary statistic that measures the dispersion of incomes on a scale of zero to one. A Gini of zero reflects perfect equality, where every household has the same income. A Gini of one represents perfect inequality, where one household has all the income.
Equivalence scales account for economies of scale among household members and adjust the income of households so that households with different compositions and sizes can be analysed. DOS compiles Singapore’s Gini Coefficient based on the per household member scale, modified OECD scale (used by Eurostat, the UK and Australia) and square root scale (used by OECD in its reports) for international comparison as there are differences in computation methods adopted by different countries.
For more information, you may view the Understanding the Gini Coefficient Infographic and Understanding the Gini Coefficient video.
Deciles are derived by arranging all households by their incomes from minimum to maximum before separating the households into ten equal groups. The first decile is the first one-tenth (the 10% of all households with lowest incomes). The last decile is the one-tenth of the households with the highest incomes.
Not all households are consistently in the same decile from one year to the next. For example, a household may move from a higher to a lower decile in a particular year due to temporary unemployment of a household member, before moving up the deciles when the member resumes employment in the subsequent year. In comparing the performance of any particular decile group over time, it is therefore relevant to note that the comparison may not pertain to the same group of households.
Government transfers included in different years are subject to scheme design and data availability. When administrative data on transfers are available, the coverage for Government transfers would be expanded to include them.
The full list of Government transfers included for the relevant years can be found in the 'Glossary of Government Transfers and Taxes' in the Key Household Income Trends report.
Household employment income refers to the sum of income received by employed members of the household from employment and business (including overtime pay and/or allowances). It excludes the income of live-in domestic workers. Monthly household employment income includes one-twelfth of annual bonuses and employer CPF contributions.
Household income per household member accounts for differences in household size and refers to the household employment income divided by the total number of members in the household.
The median monthly household income is a summary statistic that provides a broad indication of household income trends. It is not meant to reflect the lived experience of all households or individual members of the household.
For more illustrations, you may refer to the Why does the Reported Median Household Income Differ from My Personal Experience? Infographic.
Technical Notes
For more information on the Key Household Income Trends, you may refer to the Technical Notes document [PDF, 275.5 KB].
Glossary
Decile (decile group)
A decile group is one tenth of all households arranged by their households incomes from minimum to maximum. The first decile group is the first one-tenth (i.e., 10% of all household with lowest incomes). The last decile is the one-tenth of the households with the highest incomes. Not all households are consistently in the same decile group from one year to the next.
Equivalence Scales
Equivalence scales take into account economies of scale within the household, and adjust for household size so that households of different sizes and compositions are comparable. There are different scales used by different countries and international organisations.
Gini Coefficient
A summary measure of income inequality on a scale of zero to one. It is equal to zero in the case of total income equality and one in the case of total inequality. The more unequal the income distribution, the larger the value of the Gini coefficient.
Government Transfers
Government Transfers are unrequited assistance/benefits provided by the Government to households or individuals. These can be in cash or in-kind and can be classified into three categories:
- Regular government contributions: Recurring cash disbursements, top-ups or rebates (e.g., Workfare Income Supplement, GST Vouchers, Pioneer Generation MediSave Top-ups).
- Ad-hoc government contributions: One-off disbursements (e.g., CDC Vouchers, Post-Secondary Education Account Top-ups, One-off Retirement Savings Bonus under the Majulah Package).
- Transfers in kind: Value of in-kind benefits through subsidised services or goods (e.g., Education Subsidies, Centre-Based Infant and Child Care Subsidies).
Based on international standards and guidelines by the International Labour Organisation (ILO) and United Nations (UN) Expert Group on Household Income, capital housing transfers (e.g. CPF Housing Grant) that are large, lump sum and one-off payments have an effect beyond the year as well as an investment impact, and hence are not within the scope of household income statistics.
Government Taxes
Government Taxes are compulsory, unrequited payments made by households or individuals to the Government in cash or in-kind.
Household Employment Income
Refers to the sum of income received by employed members of the household from employment and business excluding the income of live-in domestic workers. Monthly household employment income includes one-twelfth of the annual bonus. Data on household employment income refer to household employment income before accounting for Government transfers and taxes, unless stated otherwise.
Household Income Per Household Member
Refers to the household income divided by the total number of members in the household.
Household reference person
The household reference person may refer to the oldest member, the main income earner, the owner-occupier of the house, the person who manages the affairs of the household, or the person who supplied the information pertaining to other members.
Prior to Census of Population 2020, survey respondents were asked to identify the 'head of household'. The identified person is used as the reference person to determine relationships between household members. In Census of Population 2020, the term 'head of household' has been replaced with 'household reference person'.
Household Market Income
Refers to income earned by households from the market economy. It comprises income from employment (including employer CPF contributions) and non-employment sources including investments (such as interests from savings and/or CPF balances, dividends from investments), rental, contributions from other households (such as allowance from children not staying together, alimony), pensions, annuities, royalties and regular insurance payouts.
Household Market Income (Including Regular Government Contributions)
Refers to the sum of market income and regular government contributions.
Household Market Income (After Government Transfers and Taxes)
Refers to the sum of market income, regular government contributions and ad-hoc government contributions after accounting for government taxes and the value of in-kind benefits received by households.
Median Household Income
Refers to the household income in the middle of the income distribution, i.e., half of the households have higher income than the median household income and half have lower income than the median household income.
Modified OECD Scale
The modified OECD scale assigns the first adult in the household a weight of 1 point, and each additional adult a weight of 0.5 points and each child a weight of 0.3 points. The equivalised household income is derived by dividing the total household income by the sum of the points allocated to the household members.
Nominal Change in Income
Refers to the change in income without adjusting for inflation.
Number of Working/Employed Persons in Household
The number of working/employed persons in the household includes members of the same household who were working/employed during the survey reference period. Domestic workers in the household are excluded.
Percentile Ratio
A measure of the spread of incomes across the population. P90 refers to the income level at the 90th percentile. P10 refers to the income level at the 10th percentile.
Resident Employed Households
Refers to households where the household reference person is a Singapore citizen or permanent resident and with at least one employed person. A household refers to (i) a group of two or more persons living together in the same house and sharing common food or other essential arrangements for living; or (ii) a person living alone or a person living with others but having his own food or other essential arrangements for living. Although persons may be living in the same house, they may not be members of the same household.
Real change in income
Refers to the change in income after adjusting for inflation. Nominal values are adjusted to real values using the Consumer Price Index (CPI).
=
where
: Real income in year
: Notational income in year
: CP in year
The CPI for All Items for the relevant household income group is used as the deflator to compute real income changes.
| Household Income Group | CPI for All Items |
| Overall | Consumer Price Index (CPI), 2024 As Base Year |
| 1st and 2nd Decile Groups | Consumer Price Index (CPI) By Household Income Group, Lowest 20%, 2024 As Base Year |
| 3rd – 8th Decile Groups | Consumer Price Index (CPI) By Household Income Group, Middle 60%, 2024 As Base Year |
| 9th and 10th Decile Groups | Consumer Price Index (CPI) By Household Income Group, Highest 20%, 2024 As Base Year |
Note: Real change in average household income is derived using the CPI, 2024 as base year, while real change in median household income is derived using the CPI by household income group, middle 60%, 2024 as base year.
Source of data
The data are based on the sample of households surveyed in the June Comprehensive Labour Force Surveys conducted by the Ministry of Manpower every year, except for 2000, 2005, 2010 and 2020 which are based on the Censuses of Population and the middecade General Household Surveys. The income estimates are based on income as reported by survey respondents and augmented with administrative data. Survey estimates are subject to sampling variability.
Of the 33,000 housing units selected in the sample for the June Comprehensive Labour Force Survey 2024, some 1,506 households were excluded from the survey as they were unoccupied, non-residential or demolished. A total of 27,374 households responded to the survey, achieving an overall response rate of 86.9%.
Square Root Scale
Based on the square root scale, individuals are ranked by their household income on a 'per equivalised member basis', which is derived by dividing household income by the square root of household size.
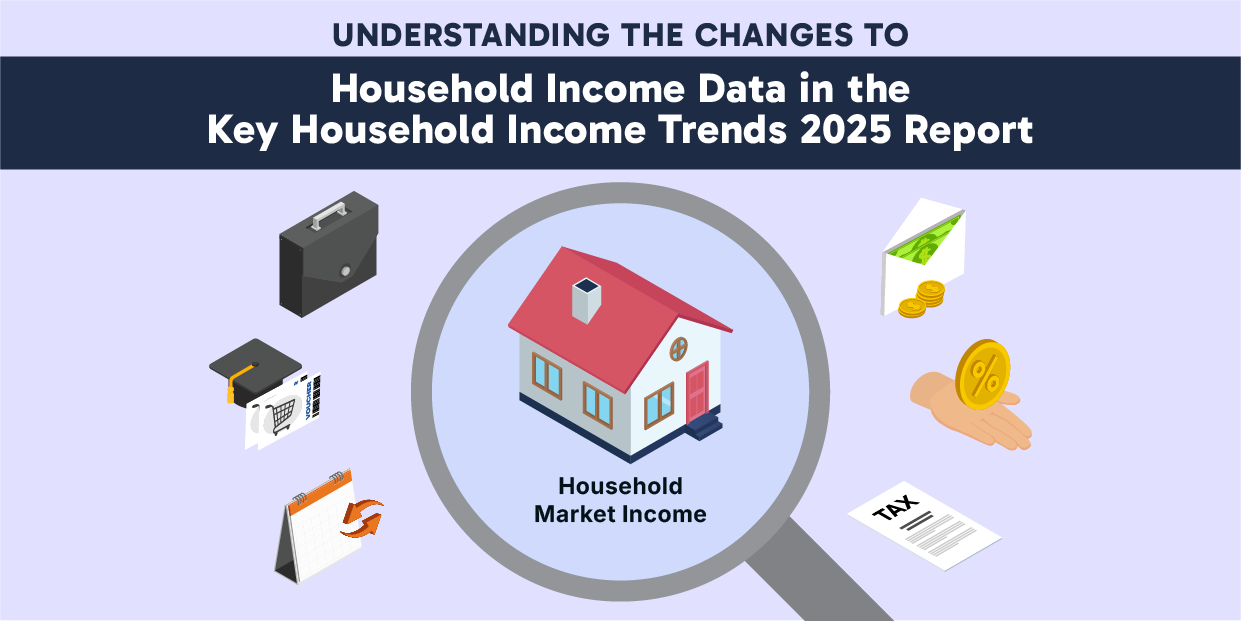
Understanding the Changes to Household Income Data in the Key Household Income Trends 2025 Report
This infographic explains the changes to the household income data in the Key Household Income Trends 2025 report.

Why Does the Reported Median Household Income Differ from My Personal Experience?
This infographic explains why personal experiences with household income may differ from the reported median household income.
Understanding The Gini Coefficient
This infographic explains the concept of the Gini Coefficient and provides an illustration of the different types of equivalence scales.

Understanding the Gini Coefficient
This video explains the concept of Gini Coefficient using simple illustrations.